Checking the Resource Usage of Your WordPress Package
WordPress Clusters has a monitoring console to collect and analyze the performance data, helping you effectively monitor and compare your sites performance over time. Whenever and wherever you are, follow the steps below, you will be available to keep track of the health of your application.
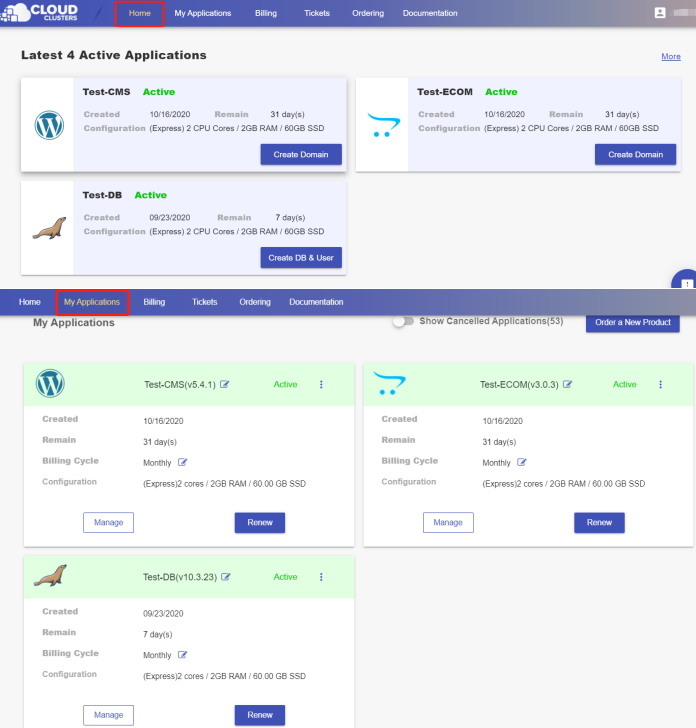
1. Locate your target deployment
Log in to the Control Panel and locate your target deployment on the Home page or the My Applications page.
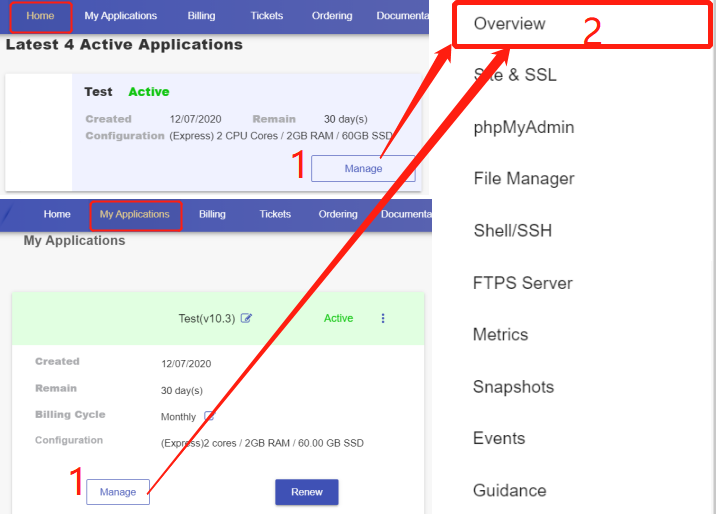
2. Go to the Overview page
Click the "Manage" button on the Home page or the My Applications page to go to the Overview page.
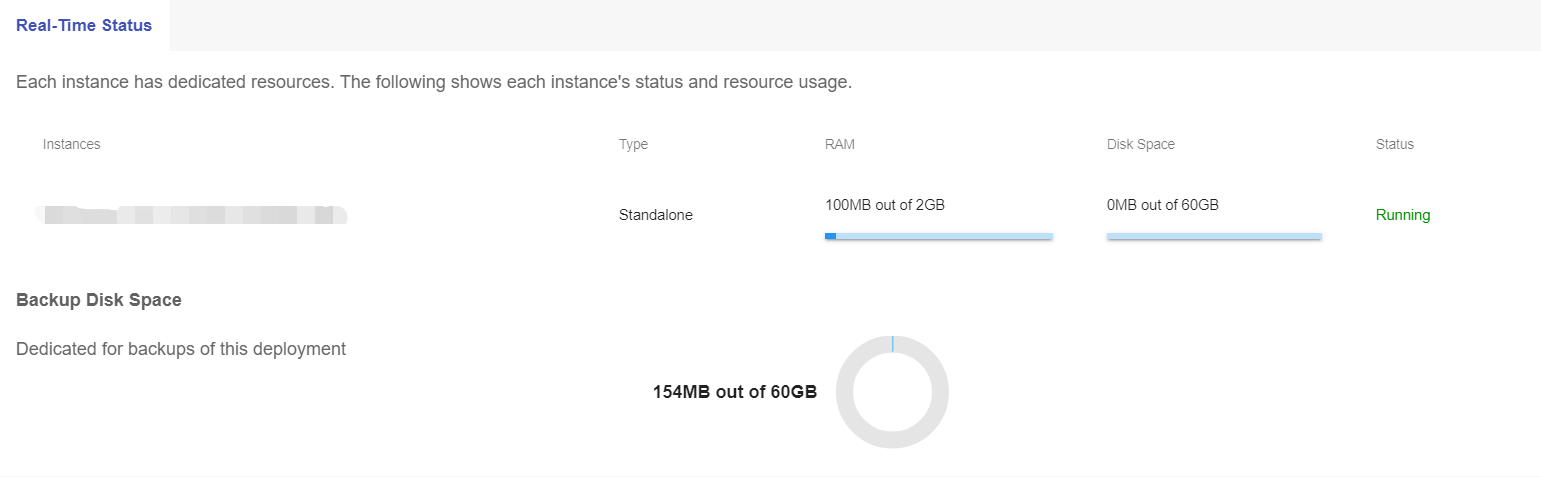
3. Check the Real-Time status
The section shows each instance's status and resource usage, including RAM, Disk space, and backup disk space.
RAM: RAM is a short-term memory. It temporarily stores (remembers) everything currently running on an instance, like all OS-specific services and any web browser, image editor. If your RAM is full, the intance could be running slowly.
Disk Space: Disk Space is the maximum amount of data a disk, or drive is capable holding. A hard drive that's too full can slow down your instance, causing freezes and crashes.
Backup Disk space: Backup Disk Space is only used to store the snapshots files. When the space is full, the newly-generated backup files could not be stored.
4. Check the Metrics
Click the "Metrics" tab on the admin sidebar to check more details about the system-level performance metrics for your instance.
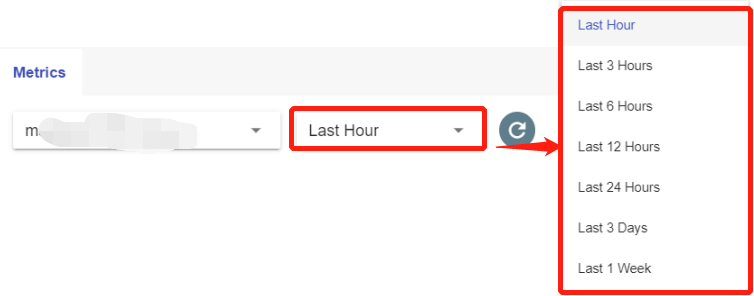
Select the time range to check the performance metrics during the period.
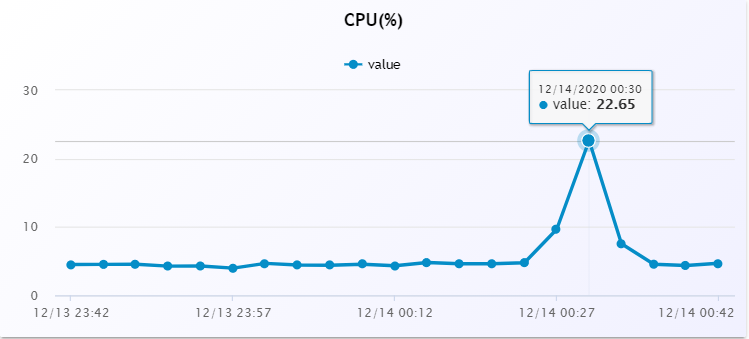
CPU: The stats were showing the percentage of used CPU. The higher the CPU usage rate at the displayed timestamp, the busier the server is. If it is consistently above 80%, please consider increasing your CPU cores.
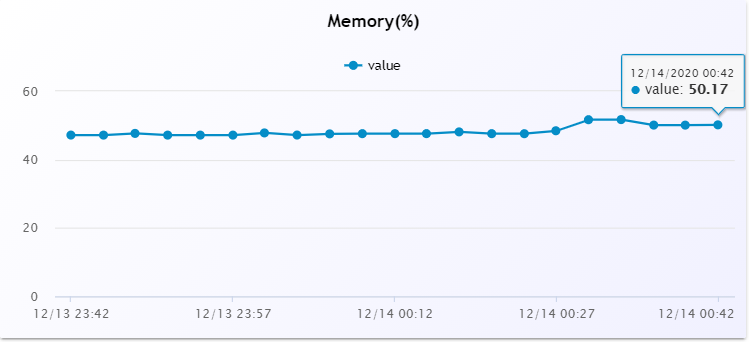
Memory: The stats were showing the percentage of used RAM (Random Access Memory). The higher the Memory usage rate at the displayed timestamp, the slower the instance could be. If it is consistently above 80%, please consider increasing your RAM.
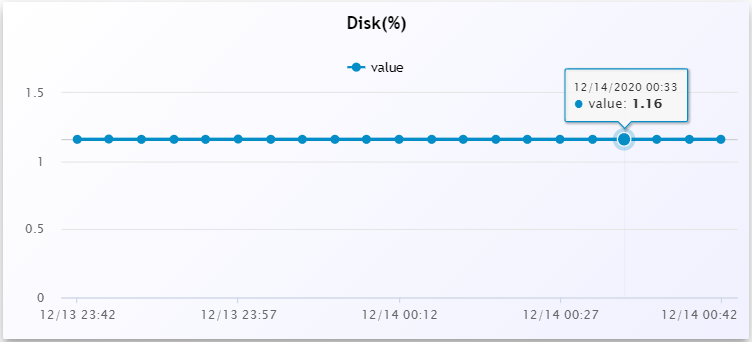
Disk: The stats were showing the percentage of used Disk space. The higher the Disk space usage rate at the displayed timestamp, the slower the instance could be. If it is consistently above 80%, please consider increasing your Disk space.
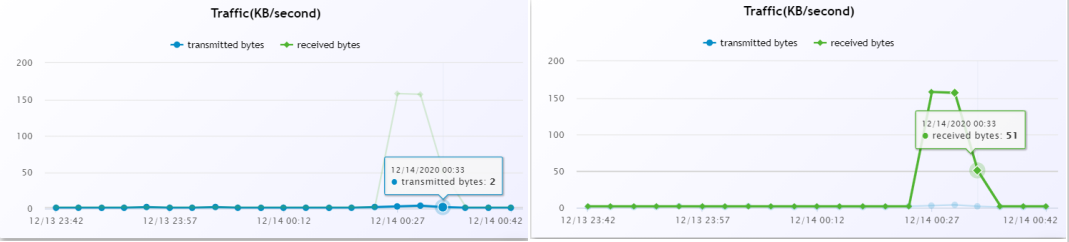
Traffic: To measure bandwidth, the total amount of traffic sent and received across a specific period of time is counted. The blue line shows the transmitted bytes (KB/second) at the displayed timestamp; while the green one shows the received bytes (KB/second).