WordPress Website Monitoring Console
WordPress Clusters has a monitoring console to collect and analyze the performance data, helping you effectively monitor and compare your sites performance over time. Whenever and wherever you are, follow the steps below, you will be available to keep track of the health of your application.
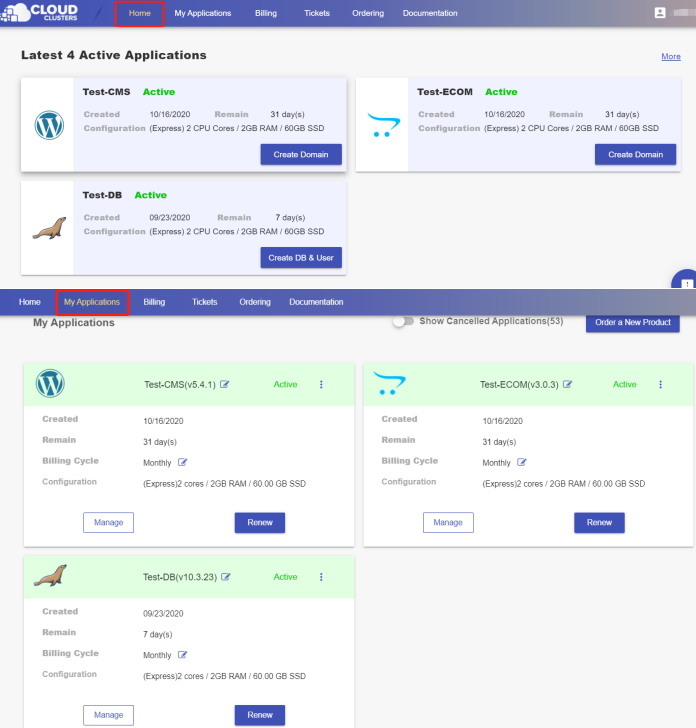
1. Locate your target deployment
Log in to the Control Panel and locate your target deployment on the Home page or the My Applications page.
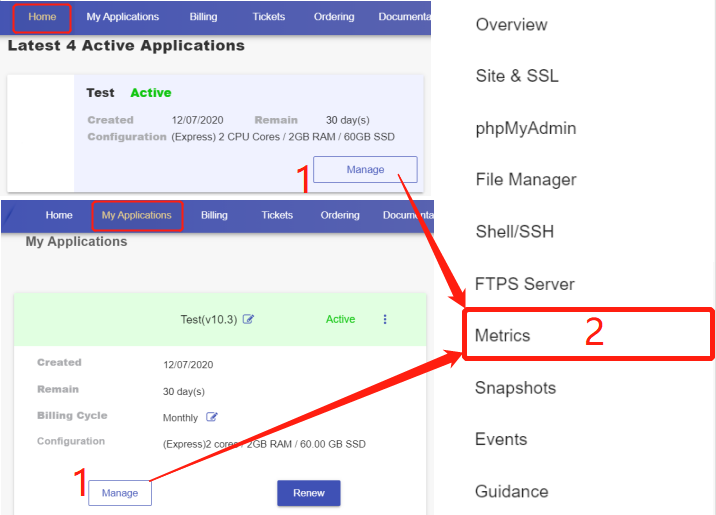
2. Navigate to the Metrics page
Click the "Manage" button on the Home page or the My Applications page. Then Click the Metrics tab in the menu bar.
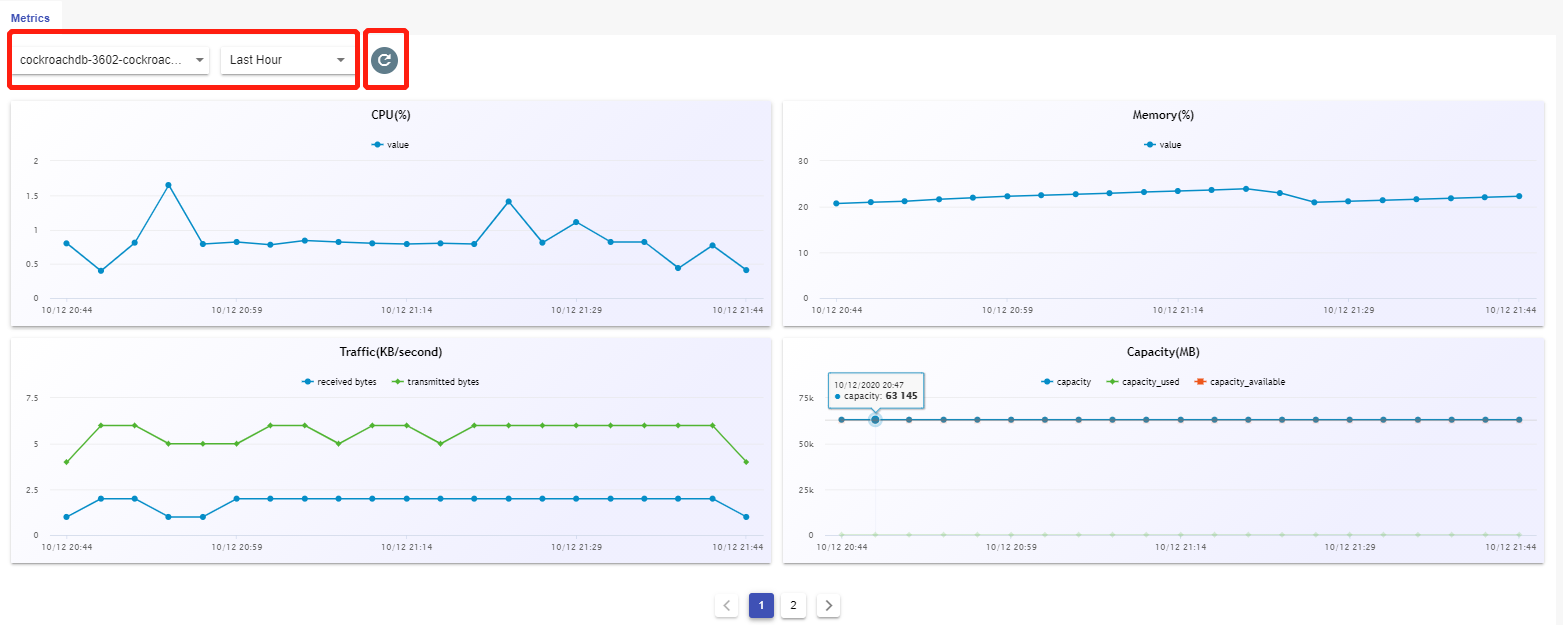
3. Monitor your website performance
On the "Metrics" page, choose the nodename and time range from the drop-down boxes below, then you will get your performance graphs in minutes. If you would like to refresh the data, simply click on the refresh icon on the right.